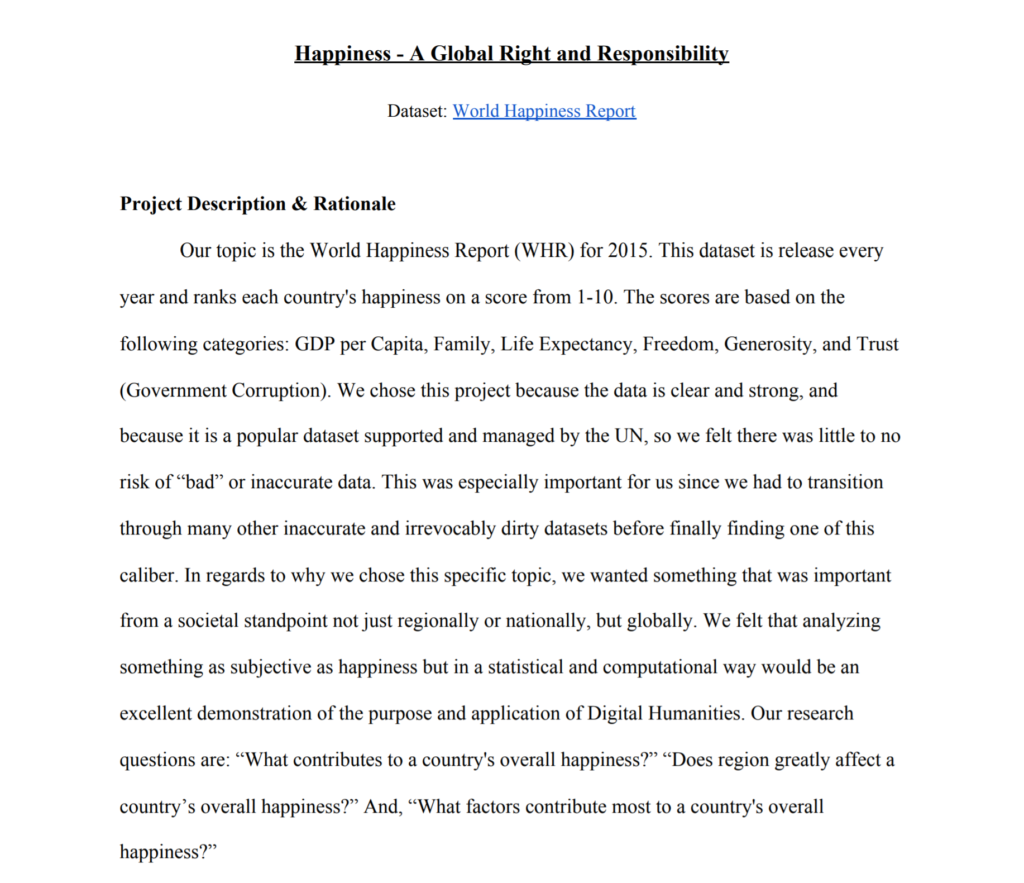
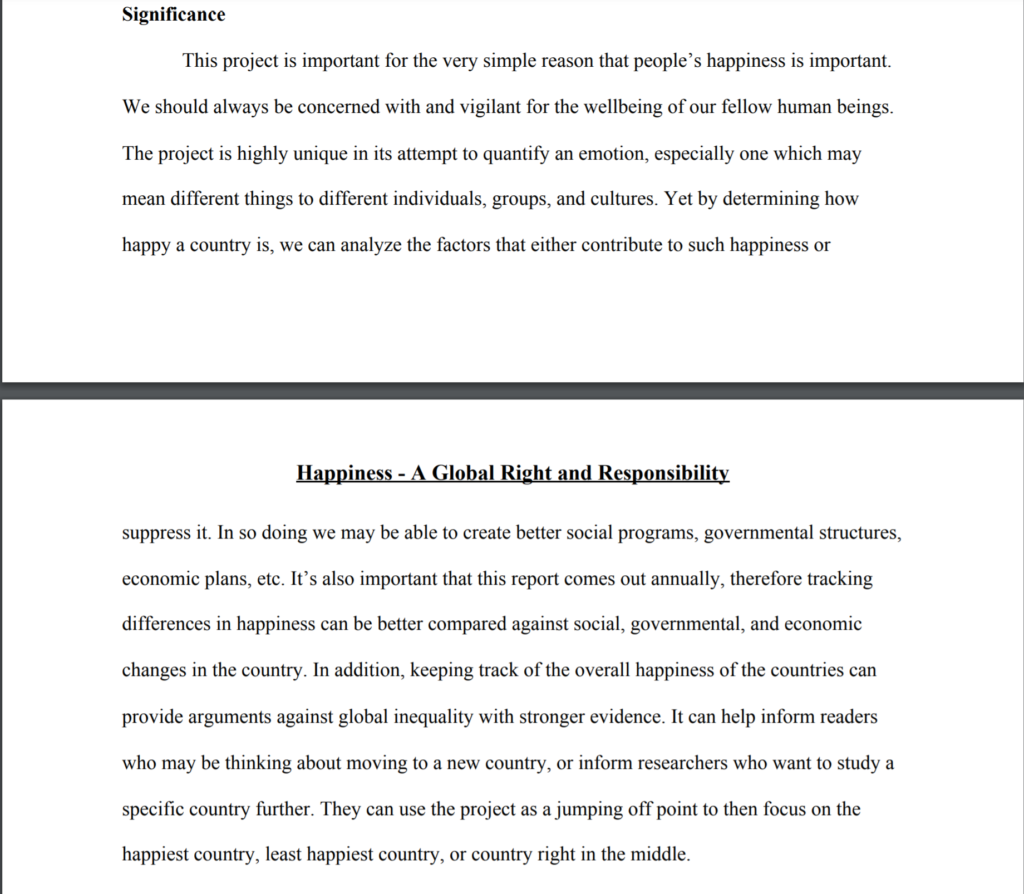
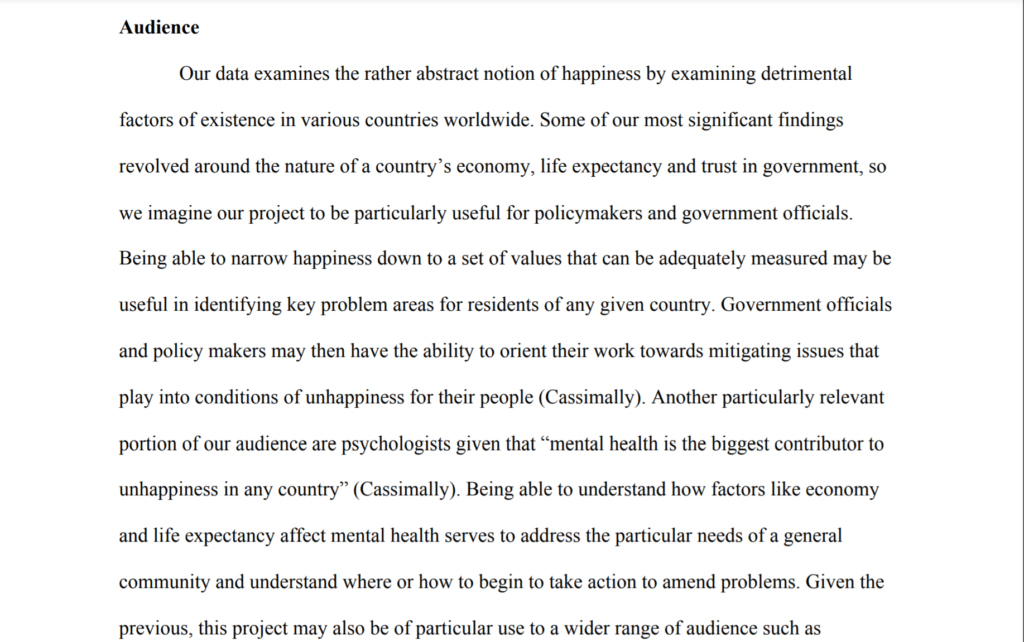
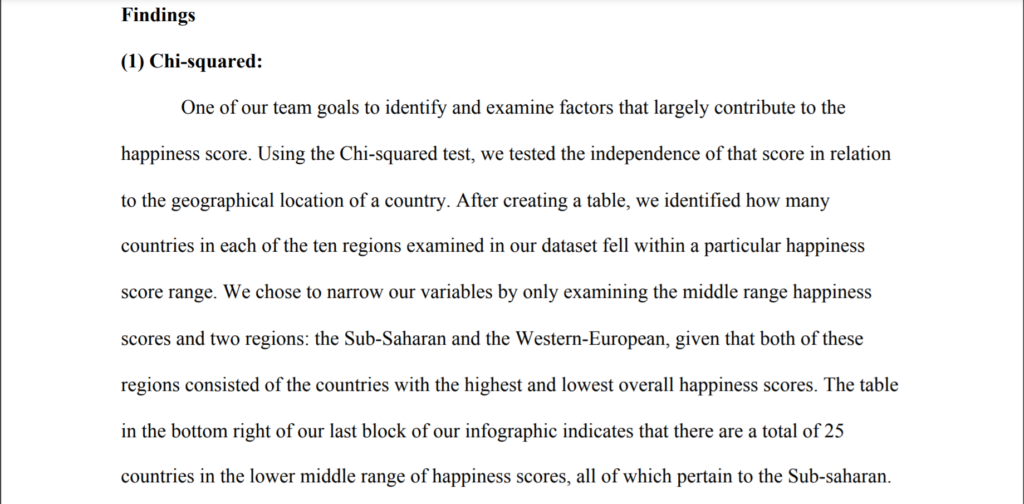
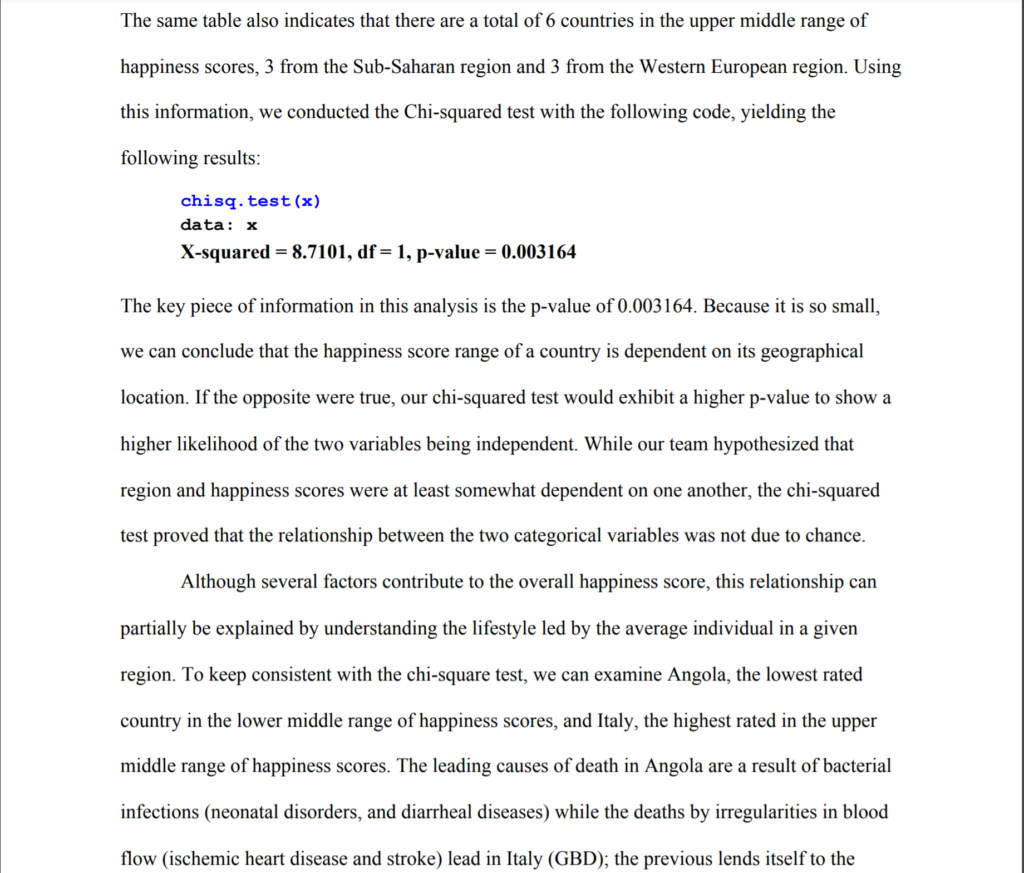
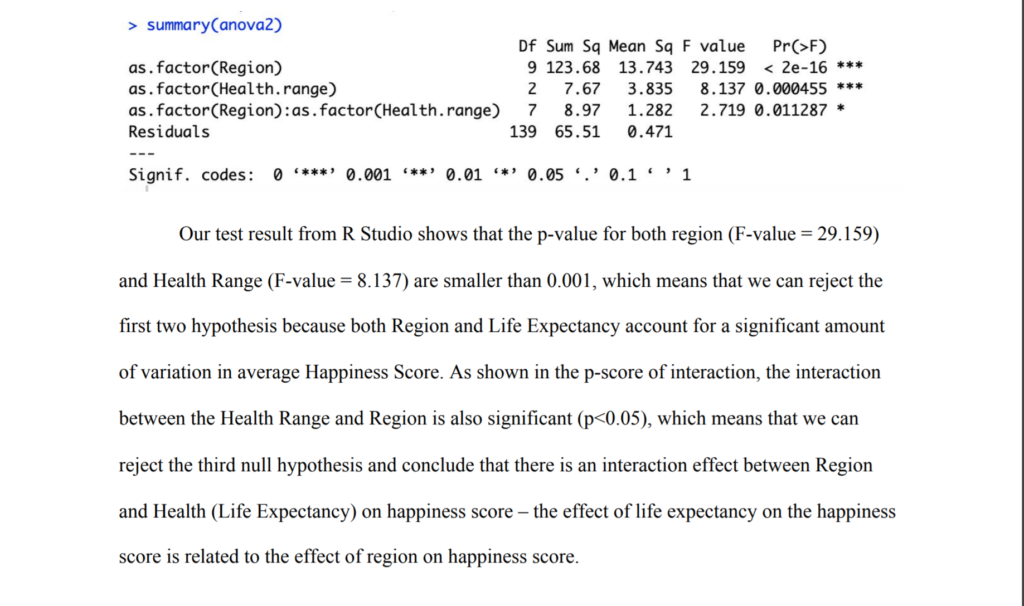
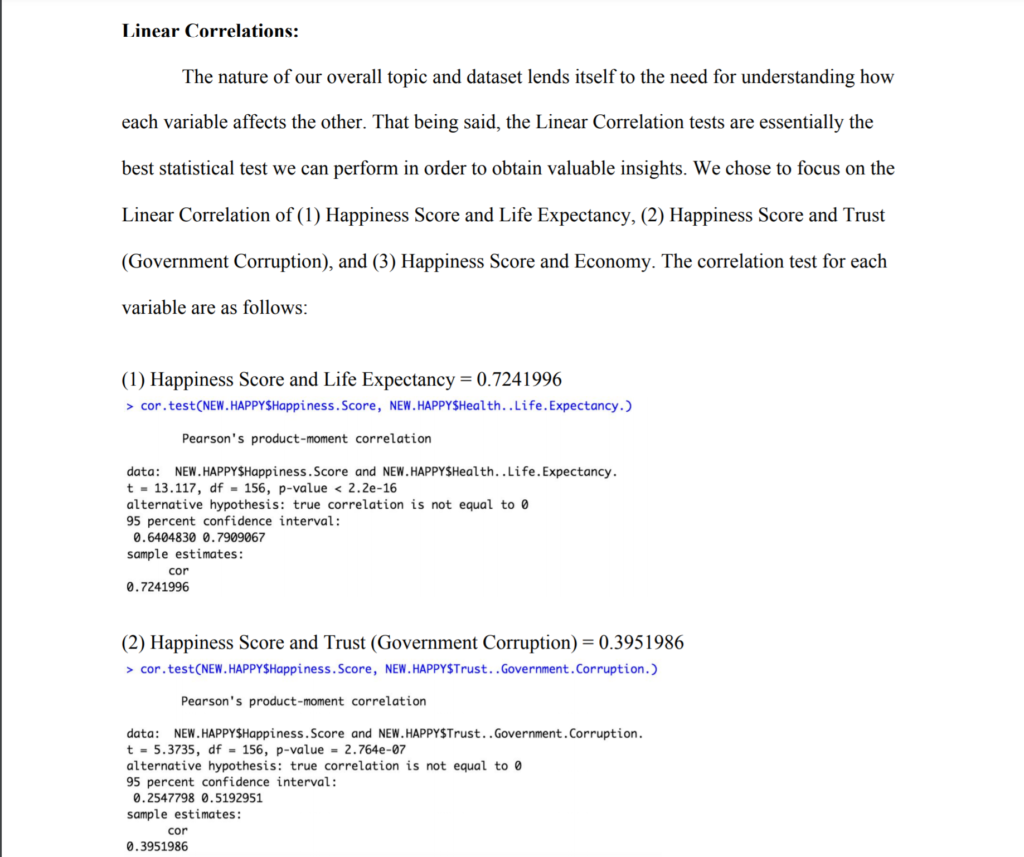
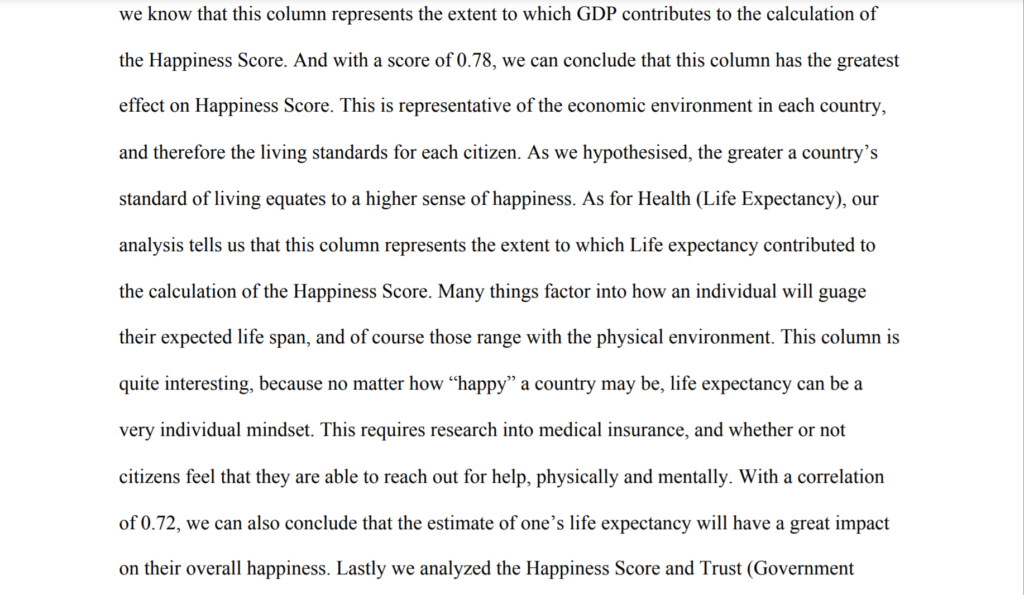
- This group project analyses the World Happiness Report for 2015 database, which is released annually and ranks each country’s happiness on a score of 1-10. Using Rstudio, Tableau, and Excel, we discovered that Western Europe is the happiest region and Sub-Saharan Africa the least happiest. We also found that economic factors are the most significant on the happiness score, and government trust the least significant. I suggested we use the World happiness Report. I coded the 5 number summaries and explained them, and coded the different tests (ANOVA, Chi-Square, etc.) and explained the significance and why or why not we reject the NULL hypothesis.
- I also worked a bit on the 2019 dataset because we originally planned on using it as a comparison to the 2015 one, but ended up scrapping that idea. I conducted a lot of the research for the white paper, put together the references, created the title, explained the project description and rationale, the significance of the project, as well as wrote the introduction and conclusion. I also contributed to the infographic by explaining the linear correlations for the happiness score, and added the intro.
- This and the LA arrests projects are the two that really opened my eyes to the inherent biases in data sets, and taught me the value of scrutable data sets that the laymen would be able to easily understand, so that people who aren’t data analysis experts can generate informed opinions and make important decisions on critical topics.

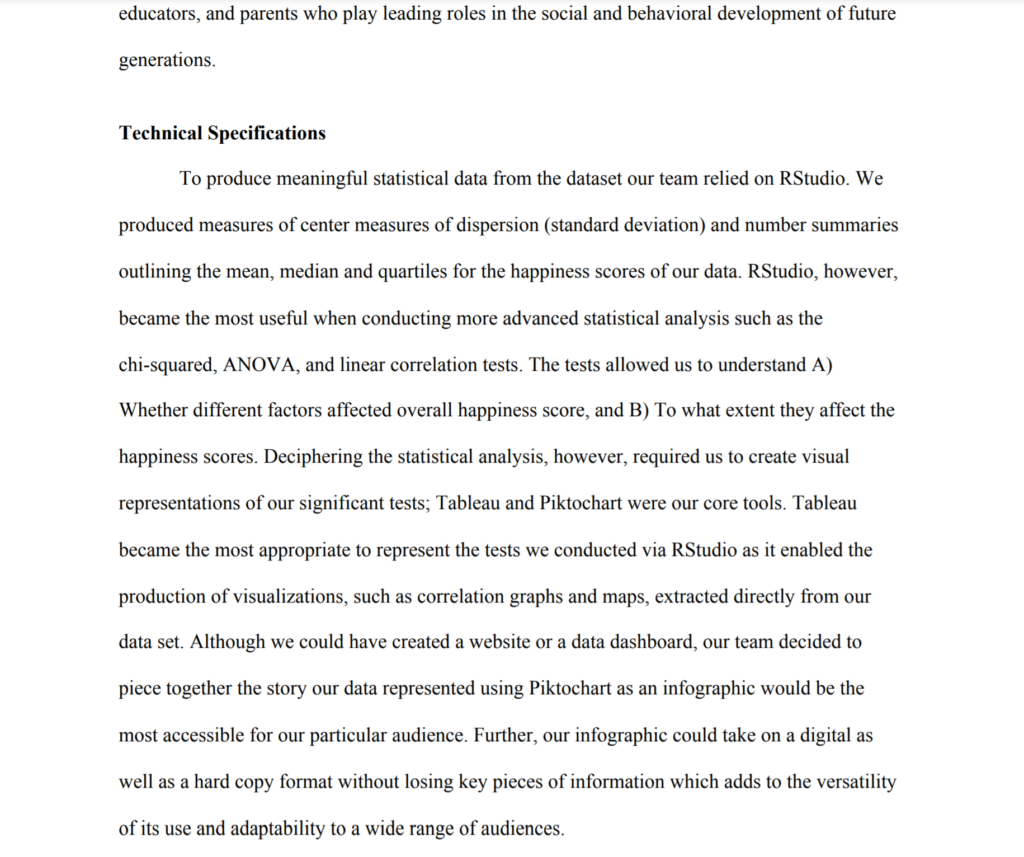

Tools Used: R, Microsoft Excel, Tableau